Oil Price Sept 5, 2026: Brent at $96, Hormuz & $100 Risk — NRG-IA
Geopolitică & Energie Author: Ioana BuzoaicaBrent closed at $96.28/bbl and WTI rose to $91.48. Tight inventories, low Hormuz flows, and a diesel squeeze keep the $100 mark in play.
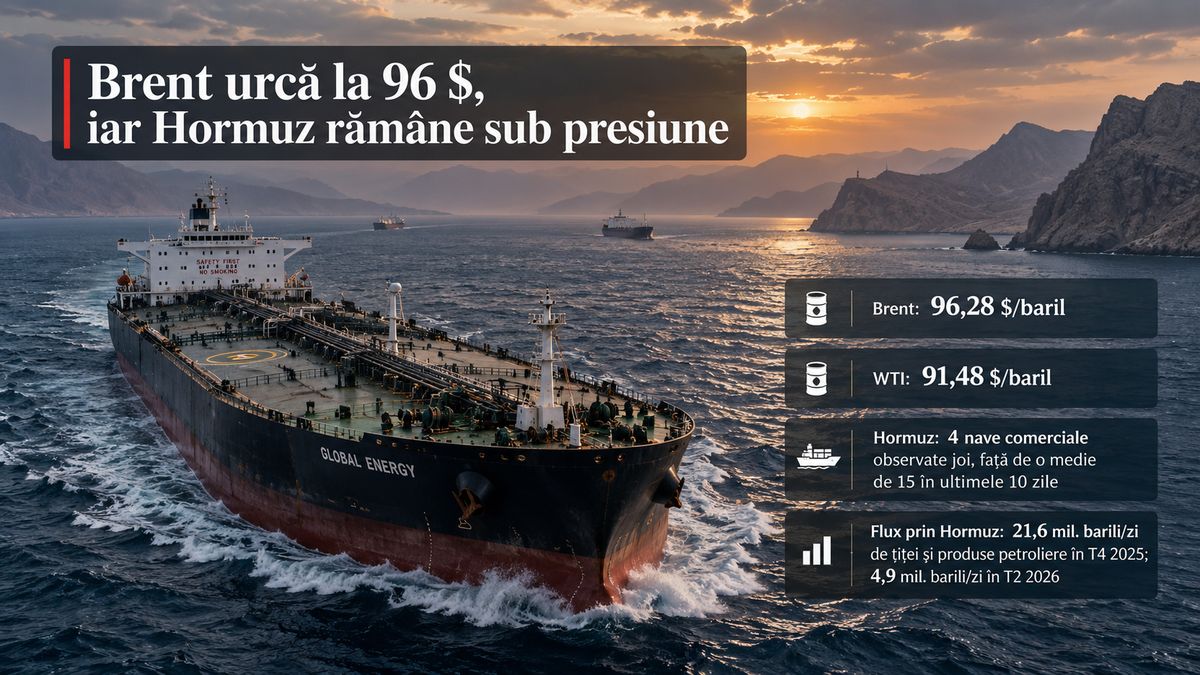
Oil ends the week in a much more fragile state than it entered. On Friday, September 4, WTI reached $91.48/barrel , approximately 9.7% above its August 28 settlement , while Brent closed around $96.28/barrel . On a comparable contract basis, Brent's weekly gain stands at about 7.6% . At first glance, the move might seem like just another trader reaction to the escalation between the United States and Iran. This time, however, the geopolitical premium is layered onto a market that has already lost a significant portion of its safety buffers. Oil flows through the Strait of Hormuz are well below pre-conflict levels, normal Iranian exports to Asia have been drastically cut, observable global inventories have shrunk by hundreds of millions of barrels, and the refined products market—particularly diesel—is tighter than the crude oil market. This combination explains why every new attack, sanction, or threat now triggers a stronger reaction than it would in a market with abundant inventories and comfortable spare capacity. Five sessions push Brent back toward $100 The week began with Brent hovering around $90/barrel and WTI at approximately $86. The US-Iran military escalation quickly altered this trajectory. On September 1, Brent gained over $4 in a single session , and WTI rose by about $4.50, as the market re-evaluated the risk of further disruption to Middle Eastern oil flows. The upward momentum continued in subsequent sessions, and by Friday, Brent stabilized around $96, while WTI cleared $91. There is an important distinction between this rally and the initial shock triggered by the war. The recent escalation has not actually removed physical oil volumes over the past few days commensurate with the scale of the price spike. A significant portion of the move therefore represents the price the market is assigning to the risk of physical supply deteriorating further . However, this risk premium is being layered on top of an already existing physical supply issue. Hormuz is not closed, but visible traffic has dropped drastically On Thursday, Kpler observed only four commercial cargo vessels transiting the Strait of Hormuz, compared to an average of about 15 over the previous ten days . This figure does not capture all traffic: vessels sailing with their AIS transponders turned off are not included, a practice that has become highly relevant in the current regional context. Nevertheless, the indicator is strong enough to show how abnormal navigation has become through one of the world's most critical energy choke points. Prior to the conflict, normal traffic was in the range of over a hundred large commercial vessels per day, with about one-fifth of the world's daily traded oil and liquefied natural gas passing through the strait. Oil volumes provide an even clearer metric. EIA data indicates an average flow through Hormuz of about 21.6 million barrels/day of crude and petroleum products for Q4 2025. By Q2 2026, this average had plummeted to around 4.9 million barrels/day . Thus, the market is no longer just trading the probability of Hormuz becoming an issue. Energy flows are already far below pre-war levels, and the current risk is that further escalation will squeeze what little remains. Iran has lost most of its normal crude exports Iran is one of the direct sources of the supply reduction. In March, Tehran was loading approximately 2 million barrels/day . By July, that volume had dropped to around 740,000 barrels/day , and in August to just 220,000–255,000 barrels/day , according to data from Kpler, Vortexa, and TankerTrackers cited by Reuters. Following the re-imposition of the US blockade on July 14, new cargoes of Iranian crude destined for China via Hormuz have virtually vanished from normal flows. While Iran continues to sell from floating storage already positioned in Asia, these inventories cannot be replenished at the same pace. This turns sanctions and maritime route controls into a physical reduction of available volumes, rather than just a diplomatic threat. The market has consumed 410 million barrels of its inventory buffer The drop in Iranian exports would have been easier to absorb in a well-stocked market. The current reality is the exact opposite. The IEA estimates that observable global inventories fell by approximately 410 million barrels between late February and late July , equivalent to an average draw of about 2.7 million barrels/day . In July alone, inventories shrank by another 69 million barrels . For the third quarter, the IEA projects a global deficit of around 1.8 million barrels/day , up from its previous estimate of 0.8 million barrels/day. With each passing month that supply lags demand, the market loses its capacity to absorb the next shock. This explains Brent's current acute sensitivity to any new developments in the Gulf. The United States adds pressure with declining domestic inventories The latest US data offered no relief to the market either. US commercial crude…
Ioana Buzoaica — Independent Editorial Board
The NRG-IA newsroom continuously monitors Romanian energy markets, ANRE regulatory decisions, and national grid telemetry (SEN/SNT). We deliver independent intelligence anchored exclusively in official primary data.
Editorial Charter, Ethics & Verification Methodology →