NYMEX Gas Tops $3.30 on EIA Report and US Heat Forecasts — NRG-IA
Gaze Naturale Author: Ioana BuzoaicaUS natural gas rose above $3.30/MMBtu on a low EIA storage injection and warm weather forecasts, signaling that summer demand is shifting market sentiment.
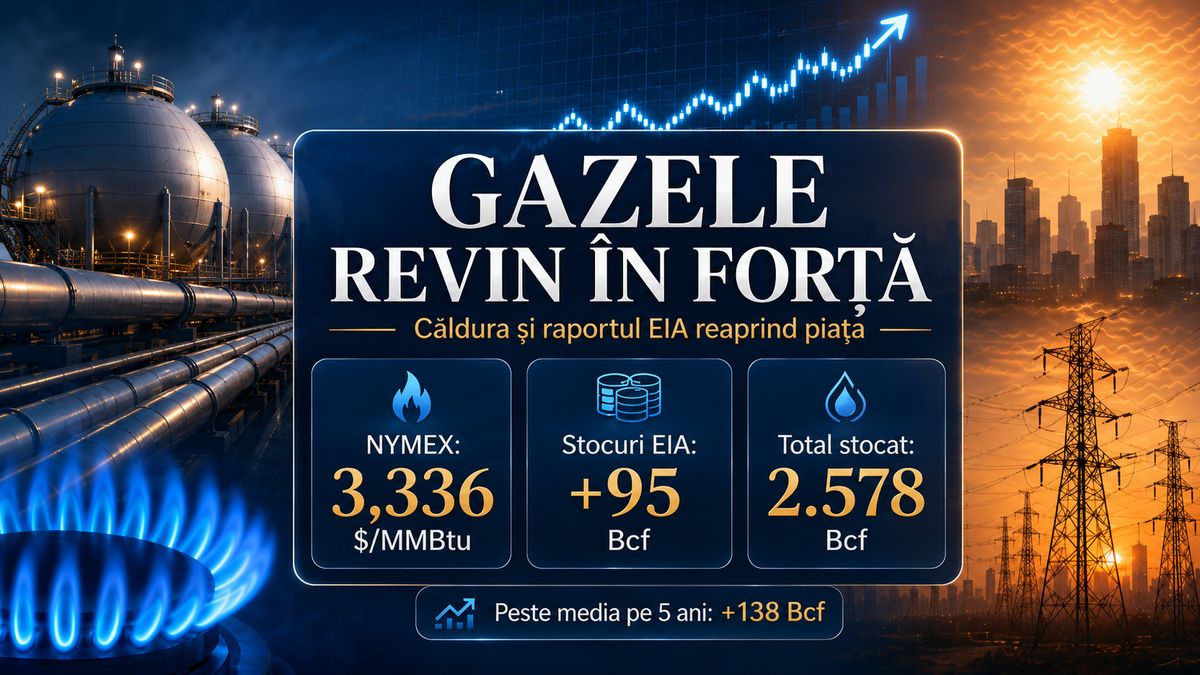
US natural gas has returned to the market's spotlight after NYMEX futures surged following the U.S. Energy Information Administration's weekly report and forecasts of warm weather. The benchmark contract closed on Thursday at $3.336/MMBtu , up 3.8% , according to the Wall Street Journal, after the market received two simultaneous signals: inventories rose less than traders anticipated, and higher temperatures could boost electricity demand for cooling. Heat changes the gas calculus For the general public, the connection might seem indirect: if it is warmer, why does gas go up? The answer lies in the US power system. In many US regions, natural gas-fired power plants generate a significant portion of the electricity needed for air conditioning. When forecasts point to high temperatures, the market anticipates higher electricity consumption and, consequently, greater gas demand in the power generation sector. The Wall Street Journal notes that prices were supported by forecasts of temperatures exceeding 90°F in the US Northeast, which could boost power consumption for cooling. This is a classic seasonal mechanism, but it becomes significant when it occurs in a market closely monitoring the pace of storage injections. CME Group lists weather and temperatures among the factors that can move the natural gas market, alongside inventory reports, demand, energy policy, and other risks. In the case of gas, the weather forecast is not just background noise; it can become a key price driver, especially at the start of the cooling season. The EIA report was more important than the raw figure For the week ending May 29, 2026 , the EIA reported an increase in Lower 48 natural gas inventories of 95 Bcf , bringing total storage to 2,578 Bcf . Inventories were 3 Bcf below last year's level and 138 Bcf above the five-year average , representing a 5.7% surplus compared to the seasonal average. The 95 Bcf figure does not indicate a market short on gas. On the contrary, total inventories remain above the five-year average. The price signal comes from the comparison with expectations. The Wall Street Journal points out that surveyed analysts had anticipated an injection of approximately 105 Bcf , and the lower-than-expected result suggested that storage facilities are no longer filling up as rapidly as anticipated. This highlights the difference between 'sufficient inventories' and a 'relaxed market.' If storage levels are above the multi-year average, the market has a buffer. However, if weekly injections begin to fall short of expectations just as summer demand approaches, traders adjust prices to account for a higher risk of a tightening balance. Why the $3 threshold matters In recent weeks, the US natural gas market has been testing the $3/MMBtu level, an important psychological and commercial threshold for futures contracts. Natural Gas Intelligence noted in late May that the front-month contract was struggling in the $2.90–$3.00 range, amid ample production and healthy storage injections. Breaking above $3.30 changes the market's tone. It does not signal a crisis, but it shows that traders are pricing in more risk from seasonal demand. On June 5, Trading Economics indicated a natural gas price of around $3.35/MMBtu , representing an increase of over 22% over the past month, although the level remained below that of a year ago. This move should be interpreted with caution. The natural gas market is highly volatile, and prices can react swiftly to weather updates, storage data, LNG flows, or production shifts. However, this week's direction shows that the market is no longer treating comfortable storage levels as a sufficient guarantee. LNG complicates the US balance Another key element is LNG exports. Reuters reported on June 2 that gas flows to US LNG export terminals had fallen to their lowest level in four months, amid maintenance work at facilities such as Golden Pass and Freeport LNG in Texas. This temporarily dampened domestic demand for export gas. Reuters also noted that average Lower 48 production had dropped to 108.8 Bcf/d in early June, down from 109.7 Bcf/d in May, while total gas demand, including exports, was projected to rise from 98.2 Bcf/d to 101.0 Bcf/d in the following week, driven by warmer weather. This is the key point for the market: if cooling demand rises at the same time that LNG feedgas flows recover post-maintenance, gas consumption could climb more rapidly. In that scenario, storage injections could shrink or fall short of expectations, keeping futures prices supported. Production remains high, but the market focuses on variations The United States remains a massive producer of natural gas. In its Short-Term Energy Outlook, the EIA shows that US dry natural gas production averaged 120.2 Bcf/d in the first quarter of 2026 , up 4% from the first quarter of 2025, and projects continued production growth through 2027. The EIA also forecasts an average Henry Hub price of approximately $3.50/MMBtu in…